CO₂ at home, in plain terms
CO₂ readings come from sensors that estimate carbon dioxide concentration in parts per million (ppm). CO₂ rises mainly when people exhale and when outdoor air exchange stays low. In most homes, CO₂ acts like a proxy for ventilation rate rather than a direct measure of harmful gases.
CO₂ is also a building block for interpreting risk. If a room has 800 ppm outdoors and 1,600 ppm indoors, the indoor air has roughly doubled the exhaled fraction compared with outdoor air. That pattern often tracks how quickly stale air gets replaced, which matters for airborne contaminants that travel with exhaled breath.
CO₂ does not measure particles, smoke, or many volatile chemicals. A kitchen with strong cooking odors can show low CO₂ while still having irritants. A sealed bedroom can show high CO₂ even when it feels “clean,” because the sensor only sees CO₂.
CO₂ sensors also have limits. Many consumer devices report accuracy around ±50 ppm or ±5% of reading, and they drift with time. Some units require periodic calibration, often using “fresh air” assumptions that can be wrong if you calibrate near traffic or a garage.
Work and learning patterns affect indoor air. Remote work and hybrid schedules increase time spent at home, which raises the chance that ventilation stays low for long stretches. Schools and offices also use CO₂ monitoring more often, and that trend has pushed more consumer monitors into living rooms.
CO₂ is not a health diagnosis. It is a ventilation signal you can act on, then verify with other measurements.
Why CO₂ numbers mislead
People often treat CO₂ like a direct “sickness meter.” That fails because CO₂ is not the main toxic agent in most indoor air problems. It tracks exhalation and air exchange, so the same CO₂ level can come from different sources and different ventilation patterns.
CO₂ can look high after a short burst. If a group enters a room for 20 minutes, CO₂ can jump quickly, then fall slowly if the HVAC runs intermittently. The peak reading matters less than the time-weighted exposure, which most dashboards do not show clearly.
CO₂ can look low while other risks rise. A strong solvent smell, new furniture off-gassing, or a nearby wildfire plume can raise irritants without changing CO₂ much. In those cases, CO₂ stays quiet while the actual exposure changes.
CO₂ can also be “stuck” due to sensor placement. A monitor near a supply vent or in a draft can read lower than the breathing zone. A monitor behind a curtain can read higher because air exchange around the device differs from air exchange around occupants.
Data flow matters. CO₂ sensors sample air at a fixed location, then the device averages readings and sends them to an app. If the app smooths data with a moving average, a short ventilation improvement can vanish from the graph, which makes troubleshooting feel random.
Skip the “one number” habit. They add one more thing to manage.
How to interpret readings at home
Start by separating “ventilation signal” from “comfort.” A practical interpretation uses both absolute ppm and the trend over time. Many guidance documents use outdoor air as a baseline and treat indoor levels above outdoor by a few hundred ppm as a sign of limited ventilation.
Use a simple reference point. If your outdoor reading stays near 420–500 ppm on a typical day, an indoor reading around 900–1,200 ppm often suggests moderate ventilation for a small room. Indoor levels above 1,500–2,000 ppm during occupancy usually indicate poor air exchange, especially if the room stays that way for hours.
Do not ignore humidity and temperature. High humidity can increase mold risk even when CO₂ looks fine. Low humidity can worsen irritation and dry nasal passages, which changes how people experience “air quality” without changing CO₂.
CO₂ interpretation also depends on room volume and occupancy. A 10 m² bedroom with 2 people behaves differently from a 30 m² living room with 2 people. The same exhalation rate produces different ppm changes based on air volume and mixing.
Conclusion: watch the trend, not the peak. Peaks fade, but exposure accumulates.
Solutions and recommendations
Set a ventilation target
Pick a target that matches your occupancy pattern. Many households aim for indoor CO₂ to stay below about 800–1,000 ppm above outdoor during occupied hours, then drop after ventilation. If outdoor is 450 ppm, that target becomes roughly 1,250–1,450 ppm indoors.
Why it works: CO₂ tracks exhaled fraction. Lower exhaled fraction usually means faster replacement of indoor air. In practice, you can treat a sustained level above your target as a cue to increase fresh air.
What it looks like: after opening windows for 10–15 minutes, the graph should slope down. If it drops only 50–100 ppm, the windows may not create enough cross-ventilation, or the room may be poorly mixed.
Tools and methods: use the device’s time series, not just the current number. If your monitor shows a 24-hour average, compare it across weekdays and weekends. I once saw firmware v1.3.2 report “current” as a 10-minute average, which made it lag behind real window openings.
Skip the “set and forget” approach. It rarely works the way the docs say.
Place sensors in the breathing zone
Mount or place the monitor where people actually breathe. A common rule is 1–2 meters above the floor and away from direct drafts, windows, and HVAC vents. Avoid corners where air stagnates, and avoid shelves that trap warmer air.
Why it works: CO₂ mixes unevenly in real rooms. Stratification happens when airflow patterns differ from occupant locations. Placement errors can shift readings by hundreds of ppm in poorly mixed spaces.
What it looks like: two monitors in the same room can disagree. If one reads 1,200 ppm and another reads 1,700 ppm, the difference often comes from airflow pathways, not actual air quality differences.
Tools and methods: if you have one monitor, do a placement test. Move it 1 meter, wait 30–60 minutes, and compare the stabilized reading during occupancy. If the reading changes dramatically, keep the monitor near the main seating area.
Conclusion: placement beats brand. It changes the air your sensor samples.
Ventilate with a schedule, not vibes
Use a repeatable ventilation routine tied to occupancy. For example, open windows at the start of a work block, then again after 2–3 hours if CO₂ stays above target. In winter, short bursts often work better than long, cold drafts.
Why it works: CO₂ decays with air exchange. If ventilation starts late, CO₂ accumulates and takes longer to recover. A schedule reduces the “I forgot” gap that drives high readings.
What it looks like: after a 10-minute cross-ventilation, CO₂ should drop noticeably within 5–15 minutes. If it barely changes, the windows may not connect to an airflow path, or the room may be sealed by weather stripping.
Tools and methods: pair window use with a fan only when it creates cross-ventilation. A fan that recirculates indoor air without bringing in outdoor air can lower perceived stuffiness while leaving CO₂ unchanged.
Skip the fan-only assumption. It can move air, not fresh air.
Use HVAC settings that bring outdoor air
Check whether your system actually increases outdoor air. Many homes recirculate most air through filters, which reduces CO₂ removal. Look for settings like “fresh air,” “economizer,” or “outside air damper,” then confirm the system responds.
Why it works: CO₂ removal depends on outdoor air fraction. Filters remove particles, not CO₂. If the HVAC runs on recirculation, CO₂ can remain high even when the fan runs continuously.
What it looks like: during occupancy, CO₂ should fall when the outdoor air mode engages. If CO₂ stays flat while the fan speed changes, the system may be stuck in recirculation.
Tools and methods: if you have a thermostat with runtime logs, compare CO₂ trends to HVAC mode changes. Some smart thermostats label modes clearly, but others hide them behind “auto” logic.
Conclusion: filters are not ventilation. They clean particles, not exhaled CO₂.
Separate CO₂ from particles and VOCs
Use CO₂ with other sensors when your goal is “air quality,” not just ventilation. Particle sensors (PM2.5) help with smoke and dust. VOC or formaldehyde sensors can help with off-gassing, though they often have higher uncertainty.
Why it works: different pollutants follow different sources. CO₂ comes mostly from people; PM2.5 comes from combustion and resuspension; VOCs come from materials and cleaning products. One sensor cannot cover all pathways.
What it looks like: if CO₂ is low but PM2.5 rises after cooking, you need source control like range hood use. If CO₂ is high but PM2.5 stays stable, ventilation may be the main lever.
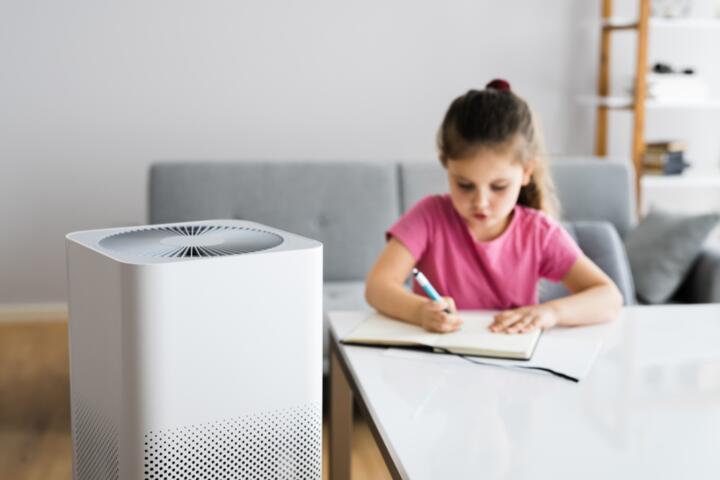
Tools and methods: if you add an air purifier, choose based on CADR or room size guidance from the manufacturer. Then verify with PM2.5 changes, not CO₂ changes. A purifier with recirculation can reduce particles while leaving CO₂ unchanged.
Skip the “purifier fixes CO₂” belief. It rarely does.
Calibrate and validate readings
Follow the calibration method your device supports. Some sensors use a “fresh air” baseline, often around outdoor CO₂ levels, while others use internal algorithms. Calibration errors can shift readings by tens to hundreds of ppm.
Why it works: sensor drift changes absolute ppm. Even if trends remain useful, drift can distort target comparisons. Validation reduces false alarms and prevents over-ventilating.
What it looks like: after calibration, the outdoor-adjacent reading should match the expected range for your area. If you calibrate in a garage or near traffic, the baseline can be biased.
Tools and methods: do a two-day check. Record outdoor CO₂ at a consistent time and compare it to indoor readings during similar occupancy. If your outdoor reading jumps by 300 ppm without weather changes, the sensor may be unstable.
Conclusion: calibrate for accuracy. Trends still matter even when drift exists.
Track time-weighted exposure in your routine
Instead of reacting to a single spike, review how long CO₂ stays above target. Many apps show graphs but not time-weighted metrics. You can approximate by noting the duration above your threshold during typical days.
Why it works: exposure depends on both concentration and time. A 10-minute peak at 2,000 ppm differs from a 2-hour plateau at the same level. Time-weighted thinking helps you choose the right intervention.
What it looks like: if CO₂ stays above 1,500 ppm for 90 minutes during meetings, you can test a 15-minute ventilation break and compare the new duration. If the duration drops from 90 to 30 minutes, the intervention works even if the peak remains similar.
Tools and methods: use a simple spreadsheet. Log start time, end time, and peak ppm for 3–5 days, then compare before and after a change.
Skip the “peak chasing” habit. It wastes effort and misses the real pattern.
Case examples
Remote worker in a sealed bedroom
A remote worker uses a single CO₂ monitor placed on a desk near a window. During 3-hour work blocks, CO₂ rises from 600 ppm to 1,900 ppm and stays high until the HVAC cycles. The person opens the window for 10 minutes at the start and again at 90 minutes, then closes it to manage temperature. CO₂ drops to around 1,200–1,400 ppm and stays below 1,500 ppm for most of the block, which reduces the duration above target.
The key change was ventilation timing, not sensor replacement. The monitor placement also mattered because moving it 1 meter away from the window draft reduced “false low” readings.
Family living room with cooking and guests
A family tracks CO₂ during evening cooking and guest visits. CO₂ peaks at 2,100 ppm when 5 people gather, then falls slowly over the next hour. PM2.5 rises after frying, even when CO₂ stays below 1,200 ppm during lighter occupancy. The family uses the range hood during cooking and opens windows during the guest peak, then runs the HVAC in outdoor air mode afterward.
They avoid treating CO₂ as a proxy for smoke. The combined approach reduces both ventilation-related buildup and particle exposure.
CO₂ interpretation checklist
| Situation | What CO₂ usually shows | What CO₂ cannot tell | What to do next |
|---|---|---|---|
| CO₂ climbs during occupancy | Limited fresh air and slower air exchange | Particle smoke levels and many VOC sources | Increase outdoor air with windows or HVAC outdoor-air mode |
| CO₂ stays low, odors rise | People exhale less CO₂ than ventilation removes | Chemical irritants from cleaning or materials | Source control: stop the product, ventilate locally, check PM/VOC sensors if available |
| CO₂ drops slowly after airing | Poor mixing or weak airflow path | Whether the sensor sits in a draft zone | Reposition sensor and test cross-ventilation, not just a single cracked window |
| CO₂ readings jump by 300+ ppm | Occupancy change or sensor drift | Whether the baseline is calibrated correctly | Check calibration method and compare to outdoor readings at a consistent time |
Common mistakes
Using CO₂ as a single health score
Why it happens. CO₂ numbers look like a direct “good/bad” metric, and apps often display only one line. People also remember CO₂ from outdoor air discussions, so they treat indoor ppm as a universal indicator.
Impact. You can miss smoke, chemical irritants, or dampness while chasing ventilation. That leads to wasted time and continued exposure to non-CO₂ hazards.
How to avoid it. Pair CO₂ with at least one other signal: PM2.5 for combustion and humidity for moisture risk. Then choose interventions that match the source.
Placing the sensor near vents
Why it happens. People mount monitors where power is easy or where the device “looks tidy.” Drafts and HVAC jets create local mixing that differs from the breathing zone.
Impact. You may under-ventilate because the monitor reads low, or over-ventilate because it reads high near a stagnant pocket.
How to avoid it. Place the sensor 1–2 meters high, away from direct airflow. Do a 30–60 minute placement test during occupancy.
Calibrating at the wrong time
Why it happens. Some calibration instructions assume outdoor air is “clean,” but outdoor CO₂ varies with traffic, weather, and nearby sources. Calibration also gets skipped when people are busy.
Impact. A baseline shift can move your target comparisons by 100+ ppm. That causes unnecessary window use or delayed ventilation.
How to avoid it. Calibrate using the device’s recommended method and compare outdoor readings at the same time of day for 2 days.
Assuming a purifier lowers CO₂
Why it happens. Purifiers reduce particles, and people generalize that effect to gases. The purifier’s fan noise also feels like “air improvement,” even when it recirculates indoor air.
Impact. CO₂ stays high, so ventilation-related buildup continues. You may feel better from particle reduction while still breathing air with low fresh-air exchange.
How to avoid it. Verify with CO₂ trends after purifier changes. Use CO₂ to judge ventilation and PM2.5 to judge particle control.
FAQ
What CO₂ level should I aim for indoors?
Many households use outdoor CO₂ as a baseline and treat indoor levels that stay a few hundred ppm above outdoor as a ventilation warning. A practical target often lands around 800–1,000 ppm above outdoor during occupied hours, then lower after ventilation. If your outdoor reading averages 450 ppm, a target around 1,250–1,450 ppm indoors fits that approach. The exact threshold depends on room volume, occupancy, and how quickly your home mixes air.
Why does my CO₂ spike when nobody is in the room?
CO₂ can rise without occupants due to sensor drift, air leaks from adjacent spaces, or delayed mixing from HVAC cycles. A monitor near a door, hallway return, or supply vent can also “see” air from another zone. If the spike repeats at the same time, compare it to HVAC runtime logs. If it happens randomly, check calibration and placement, then verify with a second temporary monitor in the breathing zone.
Does high CO₂ mean the air is toxic?
High CO₂ usually signals limited ventilation and higher exhaled air fraction. CO₂ itself is not typically the main indoor toxin at common residential levels, but it correlates with conditions that can accompany other airborne contaminants. If you also smell chemicals, see visible smoke, or notice dampness, treat those as separate hazards. CO₂ helps you decide when to increase outdoor air, not when to diagnose a specific toxic exposure.
How accurate are consumer CO₂ monitors?
Accuracy varies by model and sensor type. Many consumer devices claim performance around ±50 ppm or ±5% of the reading, and drift can occur over months. Calibration method matters because “fresh air” baselines can differ by location and time. Trends often remain useful even when absolute accuracy is imperfect. If you need tighter confidence, validate by comparing indoor trends to outdoor readings and by checking whether ventilation changes move the graph in the expected direction.
Should I buy a CO₂ monitor or a particle sensor first?
Choose based on your likely sources. If your main problem is stuffy rooms, long occupancy, and stale-air feeling, CO₂ helps you manage ventilation. If your concern is cooking smoke, wildfire smoke, or dust, PM2.5 sensors and filtration matter more. Some homes benefit from both because CO₂ and particles respond to different triggers. If budget is limited, start with one sensor and test a targeted intervention for 3–7 days.
Author's Insight
CO₂ readings become useful when you treat them like a ventilation meter with a location-specific bias. A monitor that sits in a draft can understate the breathing-zone exposure, while a monitor in a corner can overstate it. I’ve seen people chase a peak at 2,000 ppm while ignoring that the room stays above 1,500 ppm for 90 minutes, which changes the practical decision. After you adjust ventilation, watch the slope and the duration, not just the highest point.
Key takeaways
- Use CO₂ to judge ventilation, not to score “air quality” by itself.
- Set a target relative to outdoor readings and focus on how long CO₂ stays high.
- Place the sensor in the breathing zone and test placement if readings look inconsistent.
- Ventilation fixes CO₂; purifiers and filters mainly affect particles.
- Validate calibration and compare indoor trends to outdoor changes for 2 days.